
Points of interest in visual context.
Technology & Mission
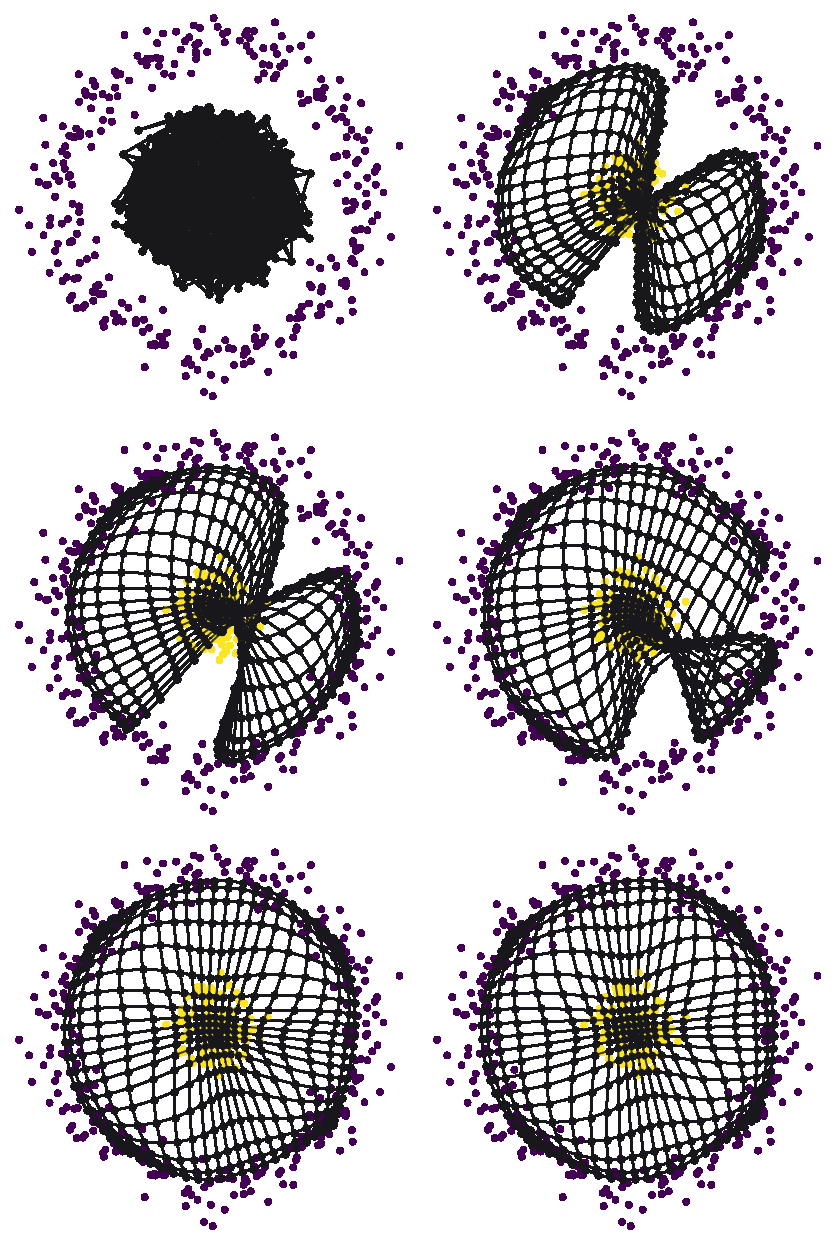
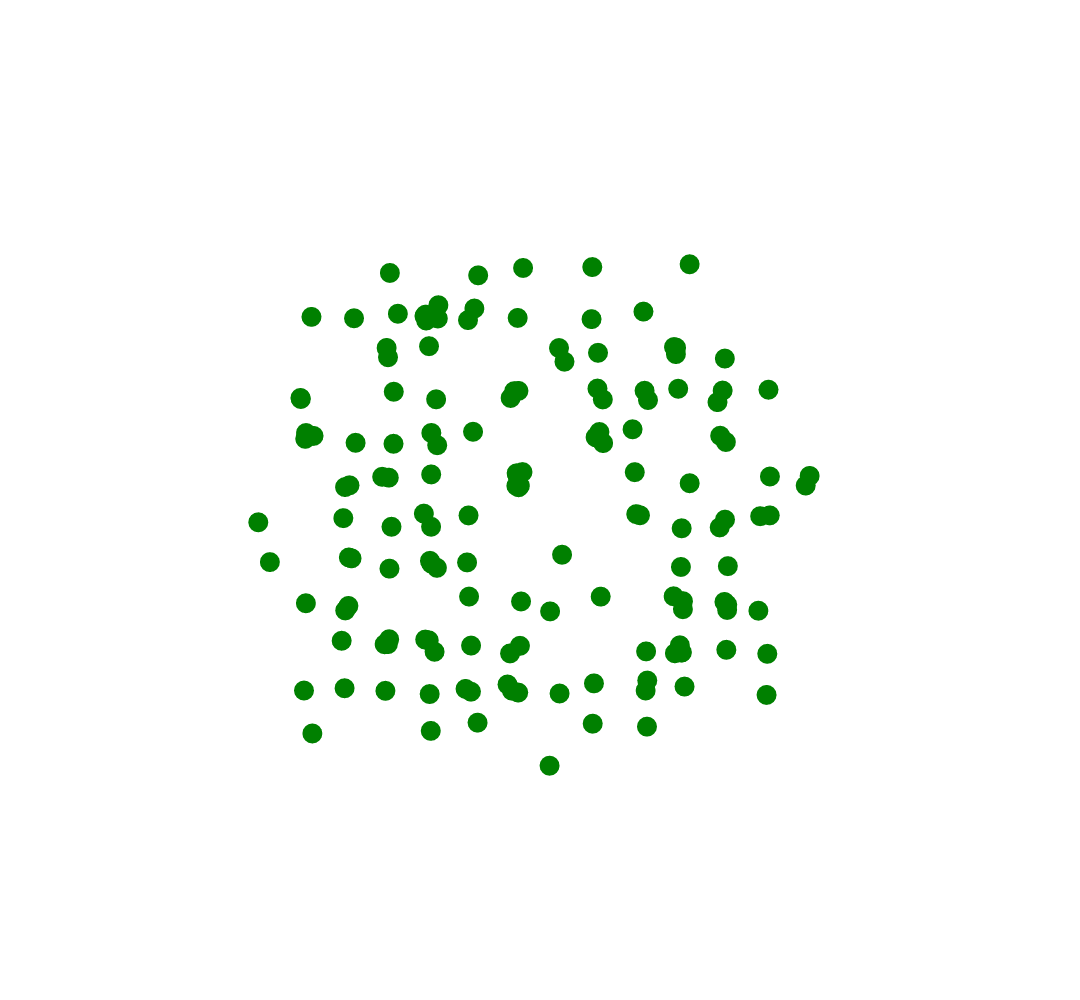
We use Self-Organizing Maps (SOM) to learn and observe the representation of high-dimensional datasets that are challenging to visualize otherwise — revealing data topology to put complex observations in visual context.
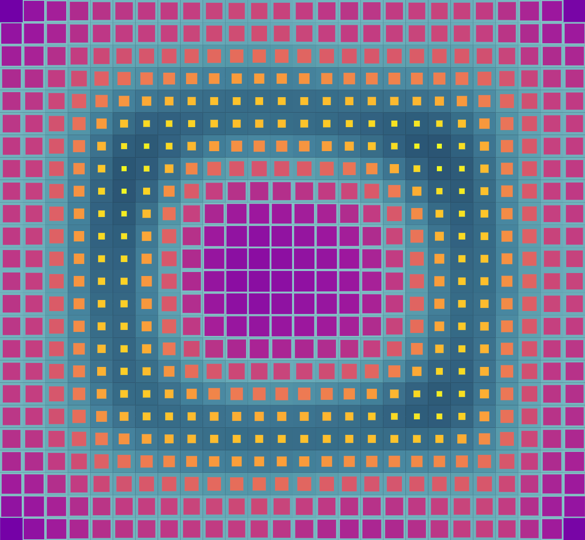
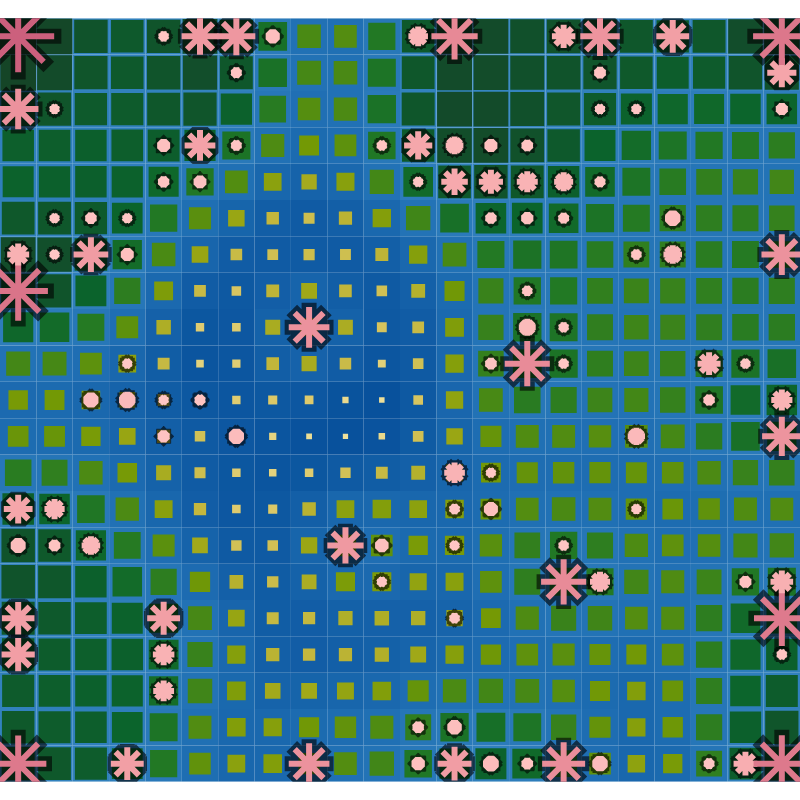
"Bianor builds upon Lilypond, the visualization tool we developed to create enhanced Self-Organizing Map (SOM) displays. Lilypond was inspired by water lilies; as you can see, the extracted maps look like clusters of lily pads floating on the water's surface. Following this metaphor, Bianor is more like a scenery of descending butterflies, where we can observe which historical pattern they land on and whether it seems out of context." — Mate Balogh, Lead at Bianor, Ophelia R&D
Applications
Discover how Bianor is being used to explore high-dimensional data.
Demonstration of the Lilypond Library
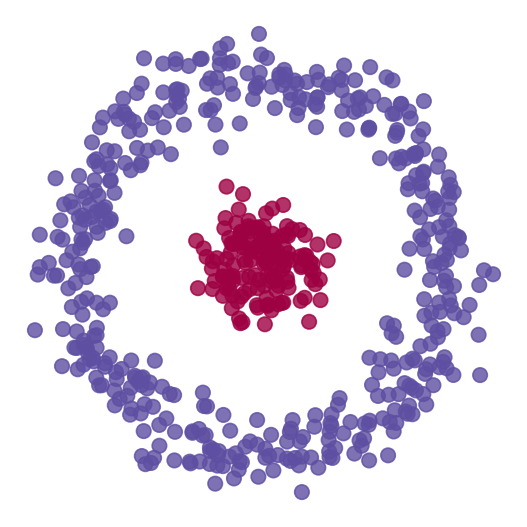
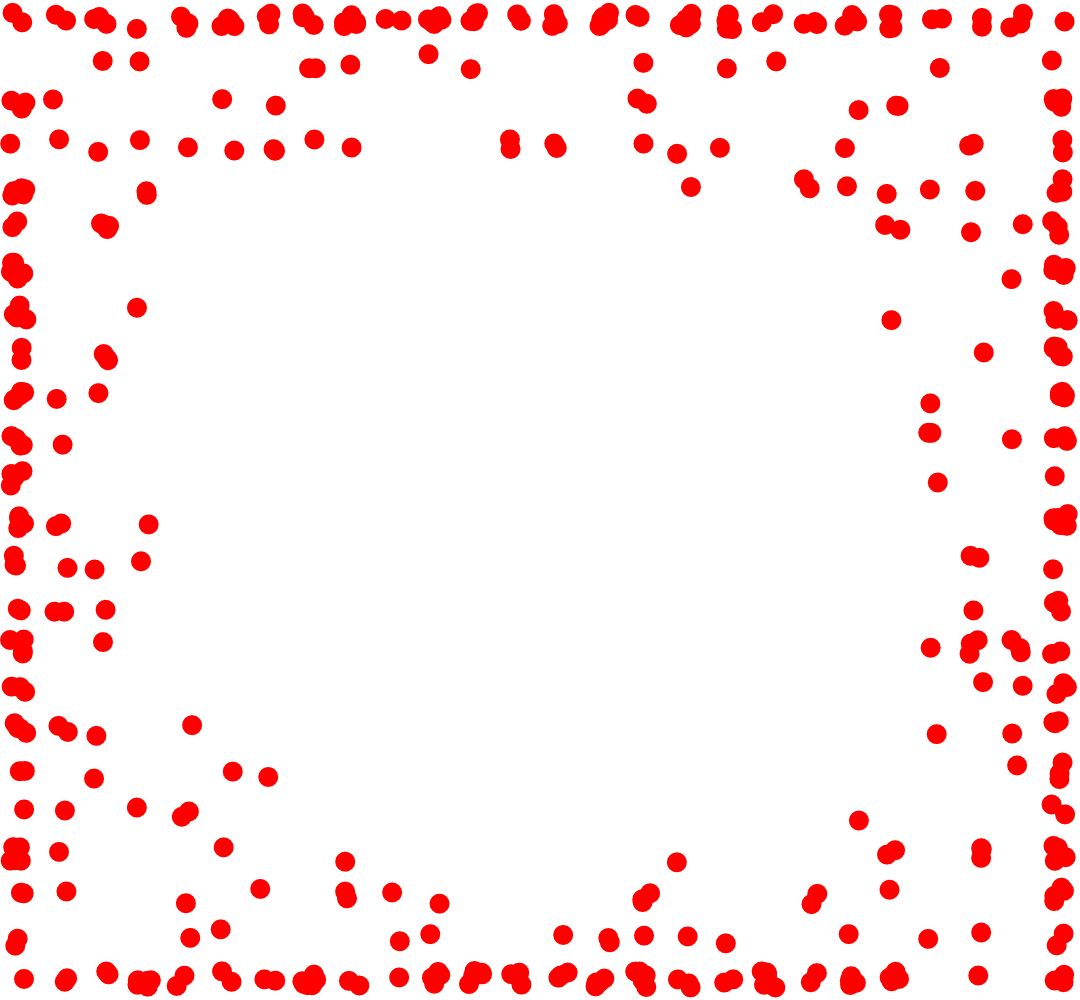
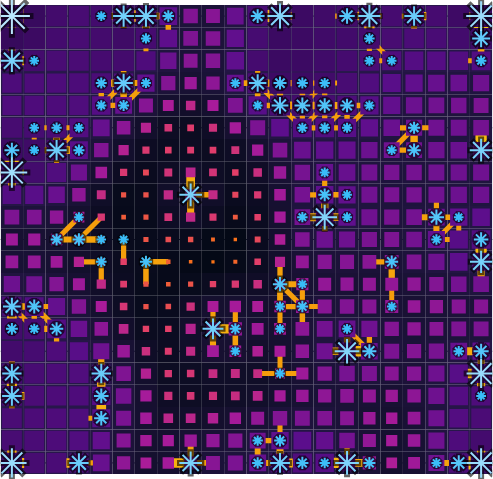
To demonstrate the capabilities of the Lilypond library, experiments were conducted across manifold learning, supervised and unsupervised analysis, and anomaly contextualization. The resulting 2D representations were interactively inspected through a dedicated Bianor instance.
Get Started
Recommended for individual researchers, data scientists, and curious minds seeking a lightweight, zero-cloud setup directly on their local machine.
-
Clone the
ophelia-rnd/bianorrepository and run it -
Train an
SomRepresentationmodel on the desired dataset and save it via MLflow -
Link your representation through the
catalog.yamlfile - Use the Bianor application to interactively inspect your data's two-dimensional representation
Our Ecosystem: Foundation & Frontier
From exploratory data analysis to automated contextual insights.
Community Edition
High-dimensional observations mapped to visual contexts in 2D.
-
SomRepresentationmodels tracked in MLflow -
Interactive visualizer with various layers and
options
powered bylilypond - Open-source
- Databricks application (optional)
Designed for data scientists, researchers — and curious minds.

Biome Edition
Advanced platform for hierarchical views and context extraction.
- All Community features
- Advanced interactive features
- Hierarchical view of representations and projections
- Instant and detailed contextualization
Designed for advanced workflows and custom requirements.